

Pittsburgh Pirates 2026 Statcast Bat Tracking Metrics: Part One
Oneil Cruz destroys baseballs like very few in the game.

I have been waiting for this for a long time.
When MLB first expanded their Statcast data to track swing paths, I knew it was only a matter of time before they released data that breaks down every aspect of a player’s swing.
Back in March of this year, FanGraphs added these new Statcast Bat Tracking metrics to their database.
To get more familiar with the new stats, I recommend this primer.
The new metrics measure bat speed, swing length, fast swing rates, and other contact and bat path metrics. I’ve been waiting to dive into these numbers after a decent sample size emerged from the 2026 season.
Below is a breakdown of each new metric, complete with MLB’s definitions, 2026 league averages, and standout performers from the 2026 Pittsburgh Pirates. This is actually part one of a two-part look, since the first part went longer than an Oneil Cruz home run swing.
Bat Speed
“How fast the sweet spot of the bat is moving, in mph, at the point of contact with the ball (or where the ball and bat would have met, in case of a swing-and-miss).”
MLB Average: 71.9
This is the most important metric when it comes to power. Home runs aren’t generated by raw strength, but by how fast your bat is moving through the zone when it makes contact. This metric shows who has a consistently fast swing.
It’s not a surprise that Oneil Cruz leads the Pirates with a 78.4 MPH bat speed. That’s third fastest in the Majors out of qualified hitters in 2026, behind only Junior Caminero and Jordan Walker.
Henry Davis (75.4), Konnor Griffin (75.2), and Joey Bart (75.0) are all in the top 30 MLB range, though Davis and Bart lack the swings to qualify for the league leaderboards. There’s a difference between the power production from Cruz and the power from each of these hitters. That shows that a consistently fast swing doesn’t guarantee power.
The Pirates have a lot of fast swinging hitters. Marcell Ozuna (73.7), Brandon Lowe (73.1), Bryan Reynolds (72.6), Jared Triolo (72.6), Nick Yorke (72.5), and Billy Cook (72.1) all finish above the league average.
On the other side of that line, Ryan O’Hearn (70.8) has been one of the most well-rounded hitters with a below-average bat speed. Nick Gonzales (70.5) has also been hitting well, albeit mostly with a contact approach that explains his below-average bat speed. Spencer Horwitz (68.4) and Jake Mangum (66.5) both lack power, which can be partially explained by well below average bat speeds.
Swing Decisions, Contact, and Quality

One of my favorite advanced metrics is O-Swing%. Also known as a chase rate.
Swing Length
“Swing length is a metric intended to identify if a batter has a short or long swing. It is calculated in terms of feet the bat traveled during the swing.”
MLB Average: 7.3
The Swing Length metric becomes a great scouting tool when paired with bat speed. If you have two hitters with an identical bat speed, the one with the shorter swing length is going to be less prone to swing and miss. They’ve got more time to react to the pitch, with the capability to match bat speed from a shorter swing.
A good comparison here is Reynolds vs Triolo. Both have a 72.6 MPH bat speed, but Reynolds’ swing is half a foot shorter than Triolo. Reynolds has more time to react and achieve a the same speed. It’s a fraction of a second, but that split-second can make all the difference against Major League pitching. Triolo actually makes more contact than Reynolds, but the quality of contact from Reynolds is considerably better.
Likewise, if two players have the same swing length, and one has a higher bat speed, that marks a demonstration of raw power.
Cruz and Griffin both have a lengthy swing at 7.7 feet, putting them both in the top 40 in the Majors. Cruz, however, has a bat speed that is 3 MPH faster. The difference in power is a .223 ISO and a .473 slugging percentage from Cruz, compared to a .138/.404 from Griffin. Both are among the team-leaders in strikeout rate and swinging strikes, which is a symptom of their long swings. Cruz has more forgiveness for his strikeouts, due to his power production, which stems in part from the greater kinetic energy generated by his bat speed.
Standouts from this metric:
O’Hearn, Reynolds, and Lowe have some of the shortest swings, and all are below the league average. They’re among the best hitters on the team. Lowe and Reynolds pair short swings with above-average bat speeds.
Horwitz has a short swing, but it’s also slow. The same can be said for Mangum.
Gonzales is one of the rare cases of above-average swing length and below-average bat speed.
Cook has the longest swing on the team, but a bat speed that is just above-average. He also leads the team in strikeout rate, showing he probably should go for a shorter, faster swing.
Davis and Bart have some of the fastest bat speeds, and their swings are barely above-average length.
Fast-Swing Rate
“Statcast defines a ‘fast swing’ as one that reaches a swing speed of 75 mph. A player’s ‘fast-swing rate’ is simply showing the percentage of all of his swings that did reach 75 mph.”
MLB Average: 25.7%
The obvious standout here is Cruz, who has a 76.3% fast swing rate. That means three out of four swings from Cruz are going to be 75 MPH or higher. By comparison, Davis and Griffin average 75 MPH, but their fast swing rate is only 56.8% for Davis and 53.6% for Griffin.
I wanted to take a closer look at these three, getting a feel for the full swing profiles, so I downloaded their 2026 bat speed charts from Baseball Savant.
First up is Cruz.
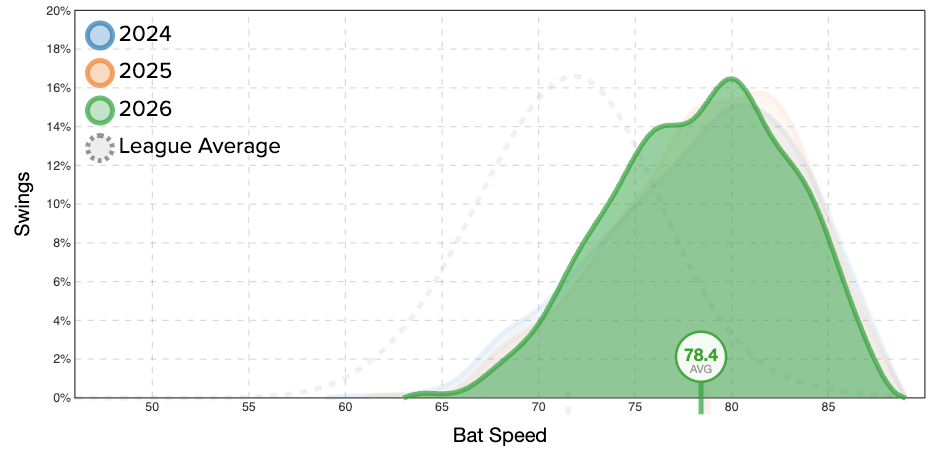
Cruz doesn’t have many swings below 70 MPH. He peaks with around 16% of his swings at 80 MPH, while also having 10% or more in the 74-84 MPH range. You’ll notice a difference in the breadth of his chart versus Davis, who is up next.
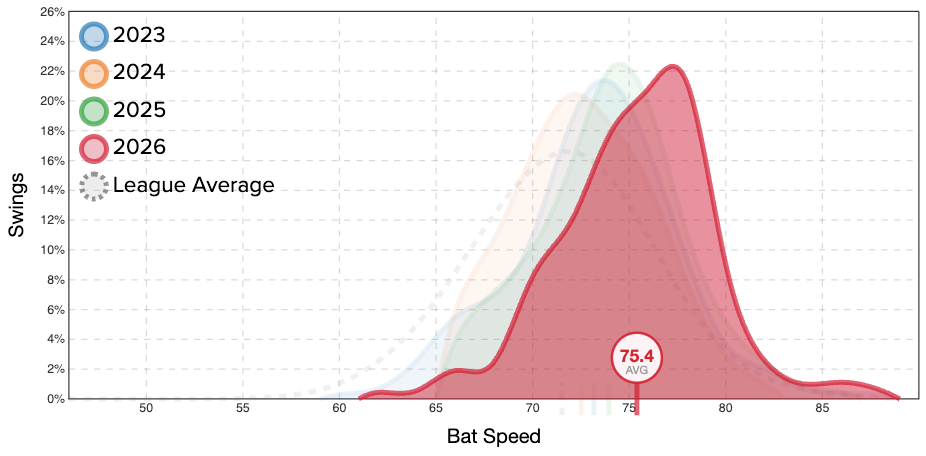
Davis peaks at 22% around 77 MPH, with a steep decline from there. Using the same 10% range as Cruz, Davis has a 10% rate from 71-80 MPH, versus 74-84 from Cruz. The bat speed from Davis sits below 75 MPH on 43.2% of swings, but his average of 75.4 MPH is due to an almost singular aggressive approach topping out around 77 MPH. This is different from Cruz, who has a fast swing at 76, a faster swing around 80, and an elite swing that can get up to 84 with consistency.
What’s encouraging about Griffin is that he matches the wider range of Cruz.
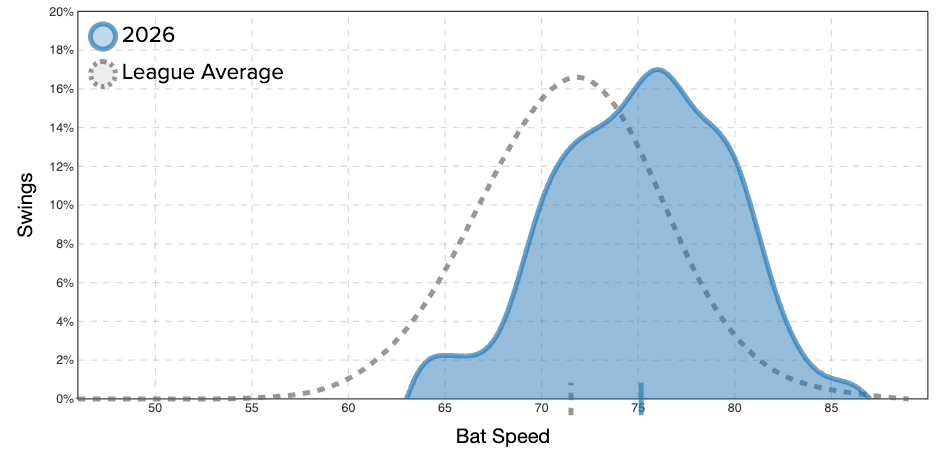
Griffin lacks the elite level bat speed of Cruz, both on the top end and at his peak, but he has a more balanced swing profile than Davis. Griffin is also about 5 MPH above the league average curve. His breadth zone of 10% or higher ranges from 70-81 MPH, which is similar to Davis. The difference is that Davis has a very consistent fast swing, while Griffin can slow his down and speed it up more often. This is really shown at the 8% level, where Griffin ranges from 68-83 MPH, while Davis ranges from 70-80.
Imagine two pitchers who can both hit 98 MPH. One of those pitchers sits mostly 97-98, while the other ranges from 95-100. If those pitchers only had a fastball, it would be easier to time the more consistent speed. The one with a wider range would force you to make adjustments. The single swing speed from Davis could be a reason why he gets pitched in the zone more often than anyone else on the team (48% vs 44.4% from Triolo at second overall). Davis is also attacked in the zone at a rate that ranks among the highest in the Majors.
On the other end of the fast swing rate, I wanted to see a few hitters who have average-to-below-average swing speeds.
First is O’Hearn, who has an 8.7% fast swing rate. Only Horwitz and Mangum have a lower rate.
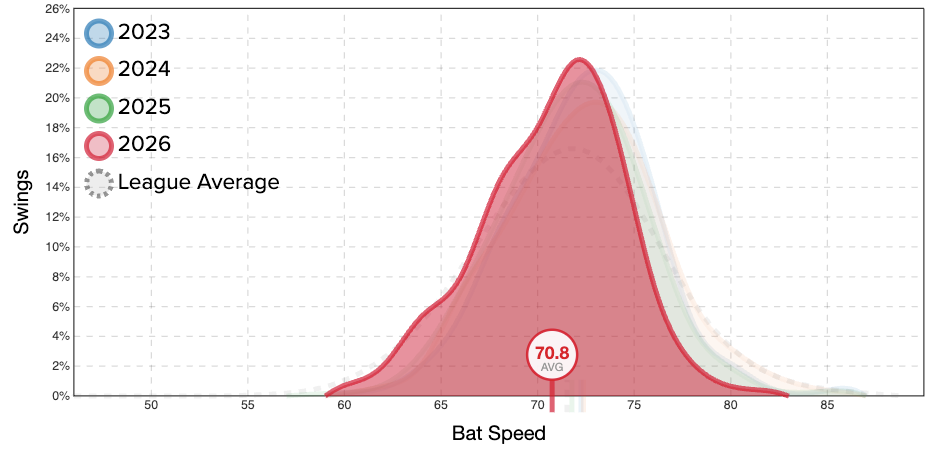
O’Hearn is a bit like Davis, only he peaks below the 75 MPH range, with 22% around 72-73. His 10% range goes from about 67-76 MPH, and his 8% isn’t much wider. He does stand out with a wide 4% range, going from 63-77 MPH. O’Hearn is almost the equivalent of a control pitcher at the plate. The bat speed is consistently low, has a wide range at that low level, but his short swing allows him longer to react, which is probably why he still hits for some power, while being one of the best well-rounded hitters on the team.
Next up is Gonzales. I noticed an interesting evolution in his swing over the last few years. Take a look at the blue area from his rookie season in 2023 in the overlay graph below.
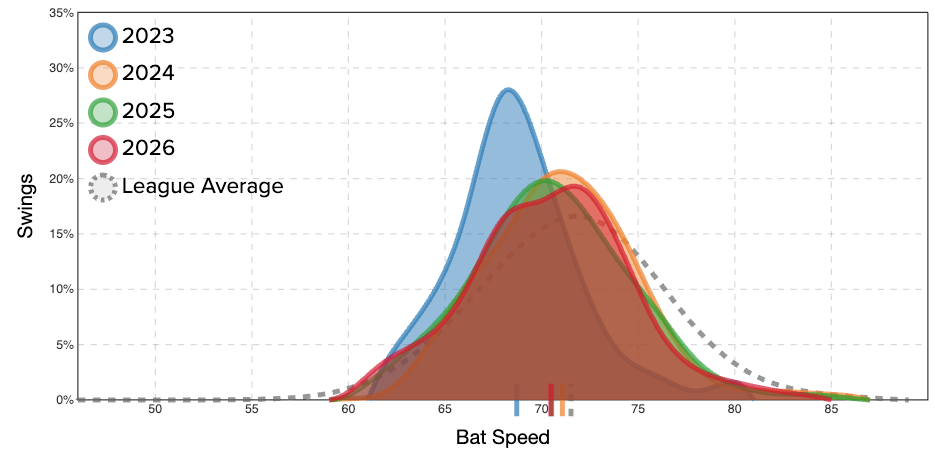
Gonzales was a slower version of O’Hearn when he first arrived in the majors. His swing speed was consistently around 68 MPH, which means he not only had a slow swing, but he also was very predictable with how often he swung at that speed. He has since widened his swing breadth, while slowly creeping above 70 MPH at his most frequent swing. The 2026 numbers, isolated:
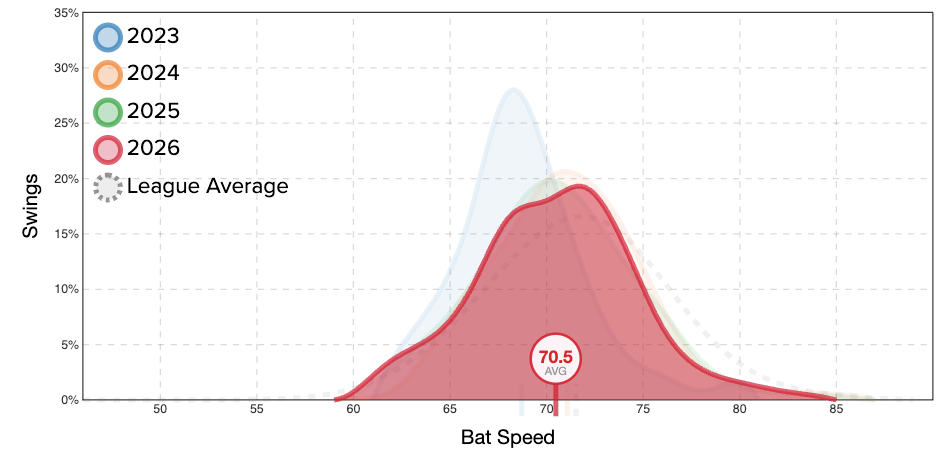
Gonzales now has a 10% range from around 66-75 MPH. He’s at 15% from 67-74 MPH. He tops out around 19% at 72 MPH, which is much different from his 28% at 68 MPH during his rookie season. He went from a 69.8% contact rate and a 15.8% swinging strike rate in 2023 to 79.4% and 11.5% this year. The swing has below-average bat speed, and above-average length, but he manages to control it well, with increased variance on the speed.
A few quick hits, no pun intended, to wrap this section up:
Reynolds has data from both sides, and an interesting trend with each.
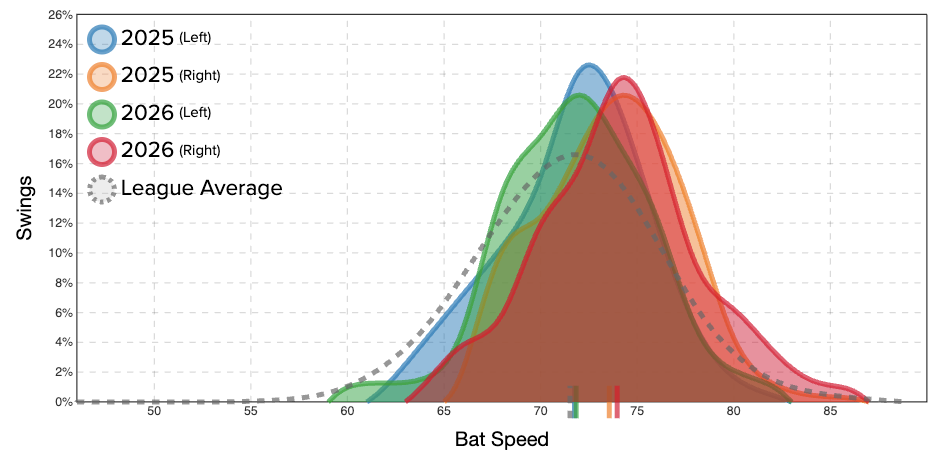
From the right-side, Reynolds has widened his bat speed frequency on the upper end, while seeing an increase in frequency around his 74 MPH peak, which remains consistent from last year. He’s traded swings from the 67-70 MPH range for more swings in the 79-87 MPH range. The left side shows something similar. He’s got fewer swings below 67 MPH, and a wider 12% range. The right-side is faster, while the left side has more variance. His wOBA was .307 L/.337 R in 2025, and is .365/.380 in 2026. The wider range from the left side has helped to better overall results, while the higher speeds from the right side have coincided with a drop from a 29% to 25% strikeout rate.
Lowe has been a successful version of a hitter who swings hard, but I want to view his last four years to see a trend.
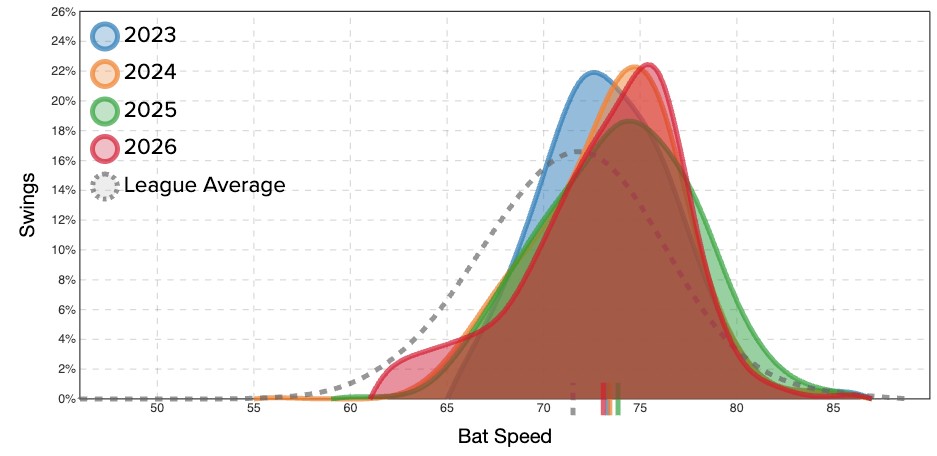
This year, Lowe is swinging harder at the most frequent spot, increasing to 22% at 76 MPH, versus 72-74 MPH at that frequency in 2023-24. His swing profile in 2025 was a wider base, with less concentration around 75 MPH, and more breadth with a 10% range covering 68-78 MPH. Lowe is hitting for more power this year than any of those previous years, and the chart above almost shows his bat speed leaning forward.
Finally, I was interested in the progress from Nick Yorke in yesterday’s article, and wanted to dive into his bat speed.
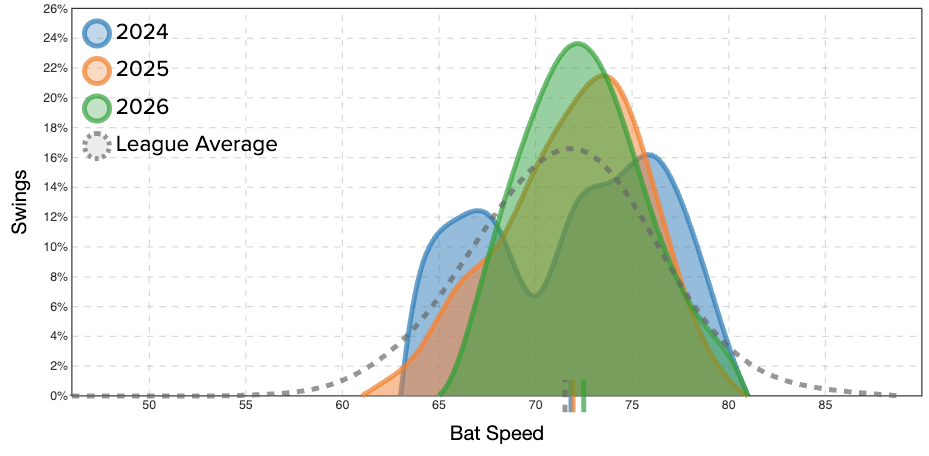
The first thing I noticed was that Yorke had two different swings when he first arrived in 2024. He peaked with a slower swing around 67 MPH, and had a harder swing around 77 MPH. There was a dip in between at 70 MPH. I haven’t seen any other hitter with such a split. The last two years have conjoined the two swings in the middle, with the 2026 rate being almost perfectly unified surrounding the 72-73 MPH range.
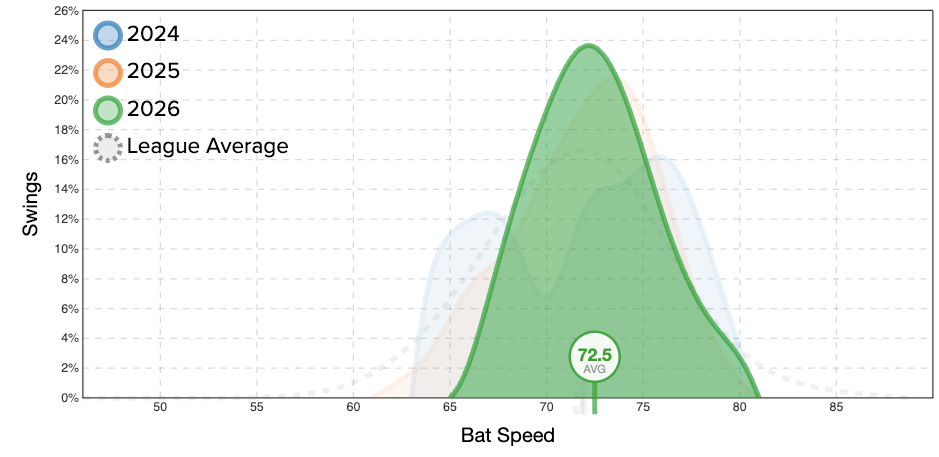
Yorke has a 67-77 MPH breadth with a 10% rate, and 68-76 at 14%. He might benefit from a wider range and less frequency around 72-73 MPH. That would require him attempting more of the 2024 approach, without the gap in the middle.
Part Two
So far, I’ve covered the bat speed, swing length, and fast swing rate, which seems like a good start. Tomorrow, I’ll resume with the rest of the Bat Tracking metrics, which are the ones that could tell an interesting story about why players are putting up certain results.
Until the next time I go live…
-Tim Williams